-(002).png?lu=245)


27 February 2014

According to industry experts such as Livingston, a combination of good planning and effective test procedures can dramatically improve the quality of network operation.
“Network monitoring is dead” proclaims cPacket, the US-based network intelligence specialist. In a statement issued last October, it said that today’s legacy monitoring solutions cannot address the demands of modern networks because they were not conceived to handle the problems that arise in large-scale data centres and high-speed networks. What’s needed are solutions that are more agile and able to deliver real-time visibility, while keeping up with the increasing complexity, volume and speed of network traffic in virtualised and cloud application delivery environments.

Rony Kay, Founder & CEO, cPacket
“Traditional monitoring architecture is like the cashier in a struggling legacy retailer,” explains Rony Kay, cPacket founder and CEO. “At legacy retail stores, during busy times the centralised cashier is a bottleneck that causes customers to stand aimlessly and wait. However in an Apple store (for example), the approach is more agile and distributed. Every employee at the store can help you with your needs and take your payment from anywhere on the floor, instantly. This distributed model delivers higher customer satisfaction and enables more efficient utilisation of space and time.
In simple terms, cPacket says that legacy architecture relies on aggregating all the traffic and analysing it “after-the-fact” in a centralised location. But increasing volume and speed of network traffic makes this legacy approach a “bottleneck by design”. It implies lower operational agility, restricted visibility, and slow response time to situations that require corrective actions, as the operation teams do not have proactive situational awareness and realtime access to true facts.
In contrast, Kay claims that ‘pervasive network intelligence’ – which is physically distributed across the network and virtually centralised – allows the “heavy lifting” of inspecting every packet and every flow in real-time. “A novel hardware-software architecture can be deployed to deliver pervasive real-time intelligence. It should combine real-time hardware inspection of every bit in every packet and every flow across the entire network environment, with radically simplified software to allow instant access to relevant information from any web browser. It’s time for monitoring solutions to catch up with the rest of the networking and data centre world.”
That all sounds like a serious wake-up call for the industry. But away from the data centre, do issues such as virtualisation, cloud, unified communications, BYOD, etc, have an impact on the types of functionality vendors need to build into their LAN monitoring tools?
“They could, but not necessarily,” says Reinier Treur, marketing director of test equipment supplier Livingston. “We see a clear shift in where testing is focused. There is now much more emphasis placed upon testing the telecommunication connections to buildings, because this has become a major bottleneck in speed and needs to be taken care of.”
It’s those bottlenecks again. WildPackets, which specialises in network and application performance analysis solutions, reckons it may have the answer in the shape of its Omnipliances. It claims these offer the “most powerful, accurate and affordable” solutions available for monitoring and troubleshooting high-speed networks.
The company says that as networks get faster, traffic volume rises but IT organisations are seeing less because traditional network monitoring and security tools cannot keep up with 10G and 40G data rates. In its recent State of Faster Networks survey, WildPackets found that 43 per cent of network engineers and IT directors reported limited or no network visibility as their biggest challenge. And while 85 per cent thought network forensics were essential, only 31 per cent implemented such a solution on their company’s networks.
On top of all that, a study by TRAC Research reveals that 59 per cent of IT leaders are concerned about the number of dropped packets, and a little over half are worried about the reliability of network data captured by current analysis solutions.
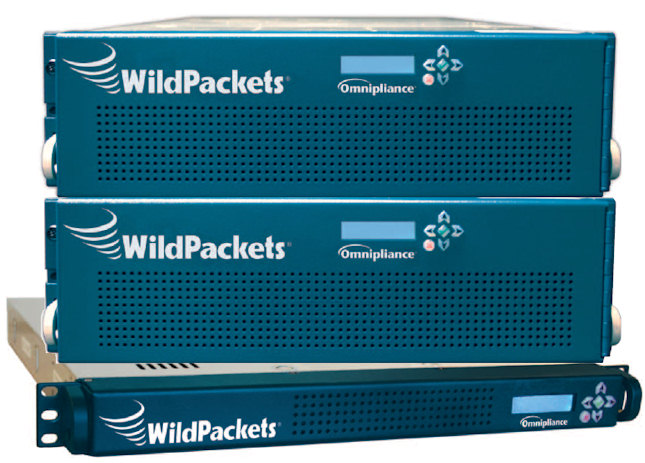
WildPackets claims its Omnipliances offer the “most powerful, accurate and affordable” solutions available for monitoring and troubleshooting high-speed networks. From top to bottom: the TL, MX and CX.
WildPackets says its Omnipliances deals with these challenges by providing IT organisations with the same comprehensive network visibility and control they have on traditional LANs and 1G networks, on 10G and 40G networks. It adds that the three models in the range are designed for rapid deployment, and offer real-time network analytics and monitoring, as well as highspeed forensics for post-incident analysis.
The CX is the entry-level model and is aimed at SMEs and remote offices of larger enterprises. The MX is said to be a “workhorse” for data centres and constantly monitors network health with its “unique” traffic capture, recording and deep packet inspection technology. The high performance TL offers continuous network traffic capture, allowing for analysis of historical network traffic and quick data retrieval for troubleshooting. The vendor says that by running its newly optimised OmniEngine software, the TL achieves packet capture at 20Gbps.
In response to its own call for solutions that need to be more agile, cPacket has expanded its cVu range of traffic monitoring switches which now include new entry-level models for branch offices and remote sites. They include, for example, the cVu-16G which features 16 interfaces in a 1U form factor, built-in LCD, and redundant power supply.
The switch is said to combine cPacket’s “unique” features of granular monitoring, performance visualisation, and proactive alerts, with the functionality of common packet brokering and matrix forwarding. It also offers: real-time pattern search (grep) by inspecting every bit in every packet in every flow; dynamic flow balancing; tunnelled meshing; user-defined triggers; automatic microburst detection; and nanosecond time stamping.
cPacket says the new switches connect seamlessly to SPIFEE, its centralised dashboard. This unifies access to all cVu devices in the entire corporate network, regardless of their physical locations. The company adds that SPIFEE offers access to visual KPIs, proactive alerts of undesired behaviours like spikes, and enables users to search for specific traffic profiles according to any combination of header fields and payload patterns.
“Our new entry-level models deliver unprecedented network visibility to teams that support branch offices and remote sites,” says Kay. “While common packet brokering functionality is also available from other companies, no other solution delivers the unique benefits of integrated performance visualisation, proactive alerts, and interactive pattern search at line rate across a distributed infrastructure.”
Ixia may take issue with cPacket here. The network test and monitoring specialist has also unveiled two new network packet brokers as part of its Net Tool Optimiser (NTO) platform to provide enterprise visibility for remote and branch offices.
“IT teams use an array of tools to proactively monitor networks and applications,” says the firm. “However, obtaining the complete data needed for in-depth, network-wide analysis is a growing challenge due to increasing network speeds, sizes and the dynamic nature of IP networks. NTO (devices) intelligently connect the network with monitoring tools to aggregate, filter, load balance and de-duplicate network traffic to make their existing tools more valuable.”
Ixia says the 2112 and 2113 network monitoring switches combine the essential core capabilities of its enterprise-class NTO platform with the port capacity and entrylevel price point needed for smaller network deployments. The new switches are said to provide: a cost-effective monitoring solution for distributed deployments; pre-configured and fully activated ports to make deployment fast and easy; and the same OS, features and UI as Ixia’s other NTO products, giving customers the ability to “learn once and deploy everywhere”.
In addition, the vendor claims the 2113 is the only full featured network monitoring switch in its class with packet filtering, load balancing, packet de-duplication and trimming, advanced header stripping and burst protection.
In December, IT management software specialist SolarWinds unveiled an enhanced version of NetFlow Traffic Analyser (NTA), its real-time network utilisation and bandwidth monitoring solution. It claims the latest version has the ability to process 50,000 flows per second or more, making it 400 per cent faster than its predecessor.
NTA is designed to analyse Cisco NetFlow, Juniper J-Flow, IPFIX, sFlow, Huawei NetStream, and other flow data. SolarWinds say it enables users to quickly capture finely granular data from continuous streams of traffic and convert those raw numbers into charts that quantify exactly how the corporate network is being used, by whom, and for what purpose. It highlights the IP addresses of “bandwidth hogs”, and allows administrators to restrict undesirable or hazardous practices.
“IT pros can see exactly when an issue occurred which allows them to make a fast and accurate diagnosis of network traffic issues such as bandwidth spikes or microbursts,” says the firm. “They can then view the data, up-to-the-minute, on interactive charts and generate reports on historical traffic usage for any applications, endpoints, or domains over a specified time interval.”
Livingston’s Treur says that as networks become more complex and faster, the industry will witness the introduction of more specific network testing instruments. One element of the network that has become increasingly important to manage, monitor and optimise is power usage.
For instance, Livingston says modern data centres need a more comprehensive and in-depth understanding of their deployed hardware’s overall power efficiency, so that opex is curbed and compliance with increasingly stringent environmental regulations can be attained.
Earlier this year, the firm added Dent Instruments’ ELITEpro XC to its range, claiming it offers a complete solution for accurately monitoring electric energy usage and recording key performance metrics. It says the XC is capable of logging, storing and analysing power consumption data derived from voltage and current inputs with typical accuracy levels of
Suitable for both single and three-phase systems, Livingston says the quad-channel analysis tool can deal with currents up to 6,000A. A waveform sampling frequency of 12kHz is supported, allowing real-time display of both voltage and current waveforms as well as harmonics. User-selectable recording intervals can be set as short as every one second, while a 16MB nonvolatile memory is said to provide months of recording time. Connectivity is via USB and standard Ethernet ports, and an optional Wi-Fi function allows remote data collection over 2.4GHz wireless networks.
Remote power monitoring is also the thinking behind two new services from UPS experts Socomec and Uninterrupted Power Supplies Ltd (UPSL). Socomec says its Link-UPS provides a permanent connection between the internal monitoring system of any installed Socomec UPS and an authorised local service centre. If the UPS’ operating parameters fall outside the permitted range, the system will identify the anomaly and automatically notify the nearest centre. A specialist Socomec engineer will then carry out a diagnostic check by remotely accessing the parameter dashboard, and conduct a root cause analysis for corrective action.
To ensure that Link-UPS operates continuously, Socomec says the connection between the UPS equipment and its service centre uses two autonomous and redundant channels; normal operation is via a secure LAN/WAN connection, but the system will automatically failover to GPRS if needed.
Reinier Treur, Marketing director, Livingston
Link-UPS also provides predictive analysis by recording and processing the UPS’ monitoring data. Andrew Wilkinson, Socomec’s regional MD, says that by combining this with constant monitoring, users can build a truly in-depth knowledge base of the equipment and the installation: “Via Link-UPS we can detect performance issues and prevent malfunction before the situation becomes critical. This holistic approach to maintenance has a positive impact in terms of the management of operating expenditure and virtually eliminates downtime costs.”
UPSL claims its PowerREPORTER service is like having a “virtual power engineer on your site 24/7”. Designed specifically for continuous monitoring and management of UPS devices, its says the service ensures that a business’ critical load and mission-critical systems are protected, even during unmanned hours.
Like Link-UPS, PowerREPORTER is also in constant communication with a user’s installed UPS system and automatically detects all error and alarm messages which it relays to engineers at a service centre for remedial action (via the user’s LAN). But unlike Socomec, UPSL says its service can work with any UPS that has an internal monitoring system that can supply the required data.
RF Code provides IT asset management and environmental and power monitoring using unique active RFID-based solutions. It has teamed up with Server Technology to provide an integrated system for monitoring and managing data centre power usage. The new system combines RF Code’s wire-free Sensor Manager with Server Technology’s Sentry Power Manager (SPM) power monitoring platform. RF Code says data gathered from its sensors flows into SPM software via an APM to provide a consolidated view of power and environmental data. The information gathered includes power utilisation (which RF Code’s sensor collects from a Server Technology intelligent PDU); temperature, humidity, etc; door open/close for greater security; and more.
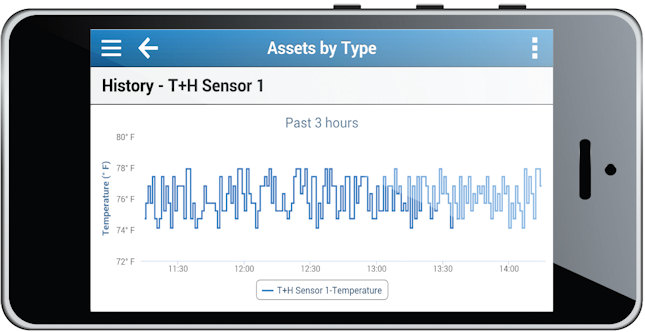
RF Code and Server Technology’s integrated system provides a consolidated view of power and environmental data.
Emerson Network Power (ENP) has added two new modules to its Trellis data centre infrastructure management (DCIM) platform. Power System Manager and Mobile Suite are said to provide a “complete visualisation” of the power system, including utilisation and dependencies, as well as secure, real-time mobile access.
Steve Hassell, president of ENP’s data centre solutions business, says: “These new modules take the most comprehensive DCIM solution to the next level by giving the user greater insight for managing their assets on the go or on the data centre floor, allowing them to reduce downtime risks, improve operational efficiency, and cut costs.”
According to the firm, Trellis Power System Manager introduces the unique ability to view the complete power chain from the grid to the rack via a one-line diagram. It says that when armed with knowledge of their current capacity and the ability to predict future needs, users can plan for capacity additions more accurately.
“When users know exactly which racks or devices will be affected by any power system failure or by scheduled maintenance, they can identify and address potential issues before they cause an outage. Additionally, the module lets users better plan for power maintenance and perform risk assessments.” Furthermore, ENP says that Power System Manager enables a global view of power across the data centre and down to a single device. “This insight enables users to gain information to manage the power system more efficiently, resulting in reduced risk of downtime and – as typically happens when efficiency is improved – lower costs.”
Trellis Mobile Suite is an iOS app that allows users to manage data centre assets from anywhere and at any time. Because the app is linked to the company’s Trellis DCIM platform in real-time, ENP says users can also take it to the data centre floor where they can find, add, move and remove racks and devices faster; carry out audits easily; and configure the database without returning to a computer.
The suite is also said to feature unique and innovative image recognition technology and barcode scanning capabilities to enable real-time updates right on the data centre floor. As a result, Emerson reckons users can save time tracking assets and updating their system while reducing the risk of human error that comes with entering data
According to Livingston’s Treur, a combination of good network planning and effective test procedures can improve the quality of network operation dramatically.
But he goes on to point out that network managers investing in test tools often end up having to make compromises because the equipment they acquire has to be used over a broad cross-section of different jobs. This could be network performance testing, delay measurement, cable testing, or troubleshooting. Sadly, says Treur, no single device offers the perfect choice. But he does offer some hope and says that net managers can avoid having to make compromises and big investments by renting, rather than purchasing, the best and latest instrumentation for any particular job.
“Very often, when we speak with network managers, they ask if we could help them with the disposal of their test tools. Sometimes, tools bought just six months earlier can already be out of use due to network changes being applied. As your network evolves quickly, our recommendation is to always keep your instrumentation pool as flexible as possible. Why invest in test tools with an operational life of three to four years if your network planning horizon is a maximum of just one year?


